Refer to the information provided in Figure 2.5 below to answer the question(s) that follow.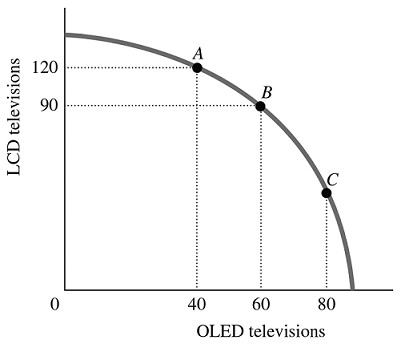 Figure 2.5Refer to Figure 2.5. For this economy to move from Point C to Point B, ________ additional LCD TVs could be produced when the production of OLED TVs is reduced by 20.
A. exactly 30
B. exactly 60
C. fewer than 30
D. more than 30
Answer: C
You might also like to view...
Kate and Alice are small-town ready-mix concrete duopolists. The market demand function is Qd = 20,000 - 200P where P is the price of a cubic yard of concrete and Qd is the number of cubic yards demanded per year. Marginal cost is $80 per cubic yard. Suppose Kate enters the market first and chooses her output before Alice. What is Kate's profit maximizing output?
A. 2,000 B. 1,333.34 C. 1,000 D. 4,000
The above figure shows supply and demand curves for milk. If the government passes a $2 per gallon specific tax, the tax revenue is
A) $2 ? Q1. B) $2 ? Q2. C) $2 ? (Q2 - Q1). D) $2.
The marginal cost curve:
A. is U-shaped. B. rises when marginal product falls, and falls when marginal product rises. C. intersects ATC at the average total cost curve's minimum. D. All of these are true.
Which nation's taxation is the highest percentage of the nations' GDP?
a. Australia b. United States c. Germany d. Netherlands e. Sweden