Graph the linear equation.x = 3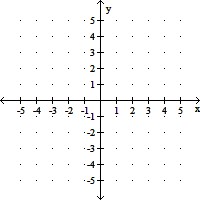
A. 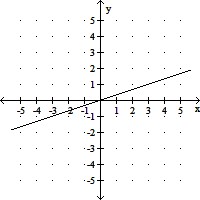
B. 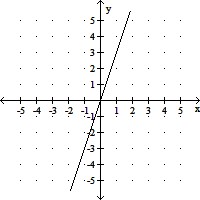
C. 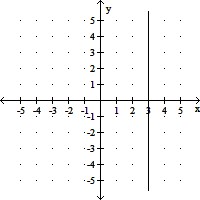
D. 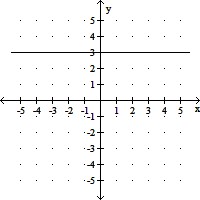
Answer: C
You might also like to view...
Solve the problem.A study in a small town showed that the percent of residents who have college degrees can be modeled by the function  where x is the number of years since 2010. Use numerical or graphical methods to find when the model predicts that the percent will be 70.
A. 2019 B. 2020 C. 2018 D. 2017
For the given function, find each of the following:(A) Intercepts(B) Vertex(C) Maximum or minimum(D) Rangem(x) = -(x + 3)2 + 4
A. (A) x-intercepts: - 5, -1; y-intercept: -5 (B) Vertex (-3, 4) (C) Maximum: 4 (D) y ? 4 B. (A) x-intercepts: 1, 5; y-intercept: -5 (B) Vertex (-3, 4) (C) Maximum: 4 (D) y ? 4 C. (A) x-intercepts: - 5, -1; y-intercept: -5 (B) Vertex (-3, 4) (C) Minimum: 4 (D) y ? 4 D. (A) x-intercepts: - 5, -1; y-intercept: -5 (B) Vertex (3, -4) (C) Maximum: 4 (D) y ? 4
Write the rational number as a decimal and state whether the decimal is repeating or terminating.
A. 0.5 repeating
B. 0.5 repeating
C. 0.5 repeating
D. 0.4 repeating
Find the indicated limit if it exists. (4x3 - 2x + 123)2/3
A. -5 B. 25 C. 125 D. -125