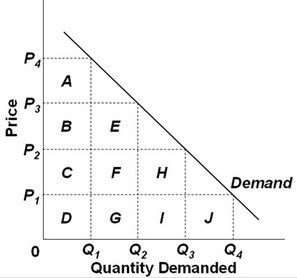
 Refer to the graph above. If the price decreases from P3 to P2, then the loss in total revenue is areas:
A. B + E and the gain in total revenue is areas H + I.
B. A + B + C + D and the gain in total revenue is areas E + F + G.
C. H + I and the gain in total revenue is areas A + B + C.
D. E + F + G and the gain in total revenue is areas H + I + J.
Answer: A
You might also like to view...
If products C and D are close substitutes, an increase in the price of C will
A. tend to cause the price of D to decrease. B. shift the demand curve for D to the right. C. shift the demand curves for both products to the right. D. shift the demand curve for C to the left and the demand curve for D to the right.
Congress and the president carry out fiscal policy through changes in
A) taxes and the interest rate. B) interest rates and the money supply. C) government purchases and the money supply. D) government purchases and taxes.
If the U.S. can produce pizza for $5 each and barrels of beer for $25 each, and Germany can produce pizza for $7 each and barrels of beer for $21 each, then
A) each country will produce both pizza and beer. B) the U.S. will produce beer and trade with Germany for pizza. C) the U.S. will produce pizza and trade with Germany for beer. D) All of the above.
The European Economic Community
a. is a good example of a customs union b. is a region in which the production of basic goods, such as steel and energy, are produced collectively c. is a free trade area d. prohibits imports from other countries e. created the GATT rules