Refer to the graph shown. According to the globalized AS/AD model, which world aggregate supply curve best represents the 2000s?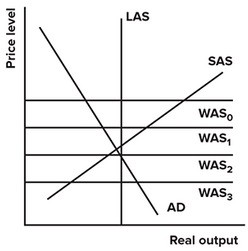
A. WAS0, and the United States had a large trade surplus.
B. WAS1, and the United States had a small trade deficit.
C. WAS2, and the United States had a small trade surplus.
D. WAS3, and the United States had a large trade deficit.
Answer: D
You might also like to view...
Maria can work as a coal miner, where the probability of being killed in a work-related accident is 5/8,000, or she can earn work as a truck driver, where the probability of being killed in a work-related accident is 2/8,000
Using the compensating differential approach, the value of Maria's life is $4 million. How much more per year will working as a coal miner pay than working as a truck driver? A) $1,500 B) $2,000 C) $2,500 D) $3,500
When the Fed buys federal government securities on the open market from commercial banks, then, over time, the:
a. assets of these banks fall. b. assets of the banks stay the same. c. assets of the banks rise. d. liabilities of the bank rise. e. liabilities of the bank fall.
A technological advance that increases the productivity of all inputs is best illustrated as: a. a movement along the production possibilities curve. b. a flattening of the production possibilities curve
c. an inward shift of the production possibilities curve. d. an outward shift of the production possibilities curve.
The quantity of reserves supplied increases as interest rates rise because
A. the Treasury borrows more at higher interest rates. B. consumers don’t want to borrow as much so more money is left in banks. C. as interest rates rise, banks fear losses so they decrease lending. D. banks find it more profitable to loan out excess reserves to other banks.