Suppose the government decides that every family should own its own home. To bring this about, the government decides to subsidize the home-construction industry by giving the home-construction companies $10,000 for every house that they build. As a result of this,
A) the supply curve of new houses would shift leftward, since it now costs $10,000 more for builders to produce a house.
B) the demand curve for new houses would shift rightward, since now every family would want to buy a house.
C) the demand curve for new houses would shift leftward.
D) the supply curve of new houses would shift rightward, since builders would be willing to produce and sell more houses at each given price.
E) c and d
D
You might also like to view...
In the figure above, when the market is unregulated and in equilibrium, marginal social cost ________ marginal benefit, and the quantity of chemical produced is ________
A) exceeds; above the efficient quantity B) exceeds; below the efficient quantity C) is below; above the efficient quantity D) is below; below the efficient quantity E) equals; efficient
In an oligopoly market, the Nash Equilibrium a. is a stable outcome despite providing a lower total profit level. b. leads to zero economic profit once the equilibrium is reached. c. results in a output level below that for a monopoly
d. always result in the maximum profit for all firms.
If aggregate demand shifts right then in the short run
a. firms will increase production. In the long run increased price expectations shift the short-run aggregate supply curve to the right. b. firms will increase production. In the long run increased price expectations shift the short-run aggregate supply curve to the left. c. firms will decrease production. In the long run increased price expectations shift the short-run aggregate supply curve to the right. d. firms will decrease production. In the long run increased price expectations shift the short-run aggregate supply curve to the left.
Refer to the information provided in Figure 2.4 below to answer the question(s) that follow.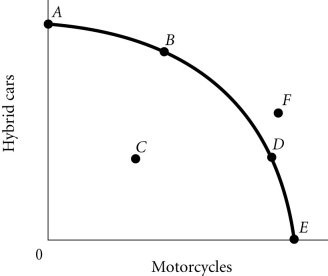 Figure 2.4Refer to Figure 2.4. The economy moves from Point A to Point D. This could be explained by
A. an increase in economic growth. B. a change in society's preferences for motorcycles versus hybrid cars. C. a reduction in unemployment. D. an improvement in technology.