Answer the question.The graph below shows estimated world population for the period 4000 BC - 2000 AD. Note that the logarithm of the world population and not actual population is plotted on the vertical axis. This means, for example, that when the graph reaches 7 on the vertical scale, world population is 107 and when the graph reaches 9 on the vertical scale, world population is 109. Log World Population  ? -4000 -2000 0 2000Why must the graph be interpreted with care? If the graph is not interpreted with care what misleading impression might one have of world population during the period 4000 BC - 2000 AD? Why do
you think that the graph was presented in this form?
What will be an ideal response?
The graph must be interpreted with care because each tick mark on the vertical axis represents a tenfold increase in population. If the graph is not interpreted with care, one might have the impression that world population increased at a linear rate between 4000 BC and 1000 AD.
The graph is presented in this form because the data ranges over a large range of values. Population has grown so rapidly in recent years that an ordinary scale makes it impossible to see any detail in the early years shown on the graph.
You might also like to view...
Plot the point whose polar coordinates are given.(-4, 2?/3)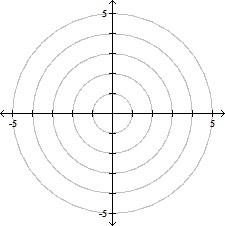
A. 
B. 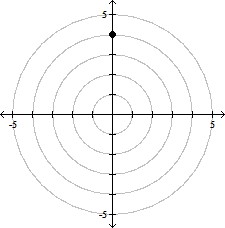
C. 
D. 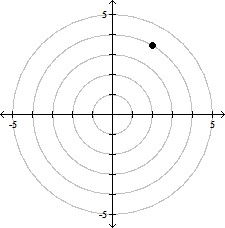
Use the given triangle and the following information: a= 7 and b= 3. Leave the answers in fraction form.
 FIGURE.png)
Find tan B.
 multiple choice.png)
Solve the problem.Find the perimeter of the figure shown below.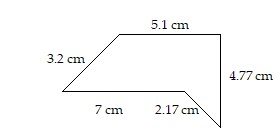
A. 15.94 cm B. 22.24 cm C. 14.77 cm D. 8.47 cm
Determine the degree of each term of the polynomial.4k3m - 12k2m2 + 9km3
A. 4k3m: degree 4; -12k2m2: degree 4; 
B. 4k3m: degree 4; -12k2m2: degree -12; 
C. 4k3m: degree 1; -12k2m2: degree 2; 
D. 4k3m: degree 3; -12k2m2: degree 2; 