The diagram concerns supply adjustments to an increase in demand (D1 to D2) in the immediate period, the short run, and the long run. Supply curves S1, S2, and S3 apply to the
Use the figure below to answer the following question.
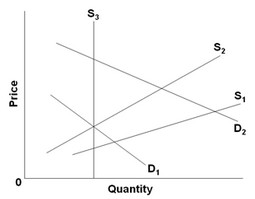
A. short run, long run, and immediate period respectively.
B. long run, short run, and immediate period respectively.
C. immediate period, long run, and short run respectively.
D. immediate period, short run, and long run respectively.
Ans: B. long run, short run, and immediate period respectively.
You might also like to view...
When housing prices ________, as they did beginning in 2006 following the housing market bubble, consumption spending on furniture, appliances, and home improvements decline as many households find it ________ to borrow against the value of their
homes. A) rise; harder B) fall; harder C) fall; easier D) rise; easier
Under the Classical assumptions, an increase in government spending causes
A) income to rise. B) income to fall. C) interest rates to rise. D) interest rates to fall.
Which of the following determines the maximum price a firm may charge for a particular quantity of output?
a. the firm's supply curve b. opportunity costs c. explicit and implicit costs of production d. the minimum point of the average total cost curve e. the demand curve facing the firm
Which of the following is a problem that arises when regulations force "natural monopolies," like electric utilities, to charge a price that is equal to their marginal cost (MC)?
a. This price will force the firms out of business in the long run. b. The firms have an incentive to pad their fixed costs. c. When price is equal to MC, new firms will enter the industry and drive up the costs of production. d. Both b and c are correct.