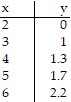
Graph the given equation with the scattergram of the data displayed in the table. Use ZoomStat to ensure all points appear on the screen.y = 
A. 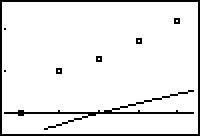
B. 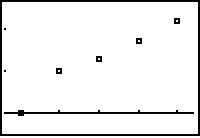
C. 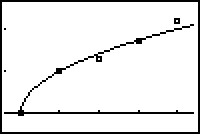
D. 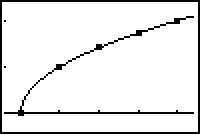
Answer: C
Mathematics
You might also like to view...
Use the graph of f to sketch a graph of the inverse of f using a dashed curve.?
A. 
B. 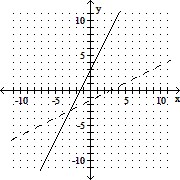
C. 
D. 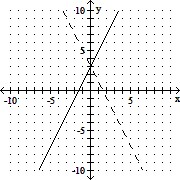
Mathematics
Solve the problem.If sin ? =  , find csc ?.
A. 6
B. 
C. - 
D. undefined
Mathematics
Graph the function. Use the graph to find the indicated limit, if it exists. f(x), f(x) = -4 - x2
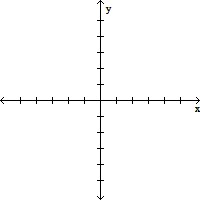
A. does not exist B. -6 C. -4 D. -8
Mathematics
Determine an equation that models the data best.
A. y =  x - 3
x - 3
B. y = -  x - 3
x - 3
C. y = -  x + 3
x + 3
D. y =  x + 3
x + 3
Mathematics