The graph below shows the percentage of students enrolled in the College of Engineering at State University. Use the graph to answer the question.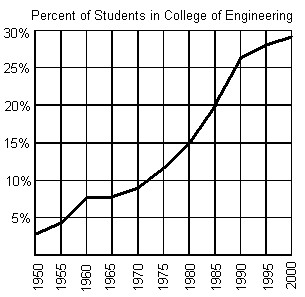 Does the graph represent a function?
A. no
B. yes
Answer: B
You might also like to view...
Find the term indicated in the expansion.(2x + 4)5; 5th term
A. 1280x2 B. 640x C. 5120 D. 2560x
Solve the problem.Body-mass index, or BMI, takes both weight and height into account when assessing whether an individual is underweight or overweight. BMI varies directly as one's weight, in pounds, and inversely as the square of one's height, in inches. In adults, normal values for the BMI are between 20 and 25. A person who weighs 163 pounds and is 67 inches tall has a BMI of 25.53. What is the BMI, to the nearest tenth, for a person who weighs 129 pounds and who is 65 inches tall?
A. 21.1 B. 21.8 C. 20.8 D. 21.5
Solve the problem.A farmer's silo is the shape of a cylinder with a hemisphere as the roof. If the height of the silo is 108 feet and the radius of the hemisphere is r feet, express the volume of the silo as a function of r.
A. V(r) = ?(108 - r) +  ?r2
?r2
B. V(r) = 108?r2 +  ?r3
?r3
C. V(r) = ?(108 - r)r2 +  ?r3
?r3
D. V(r) = ?(108 - r)r3 +  ?r2
?r2
Solve the problem.The price of electric guitars has varied considerably in recent years. The data in the table relates the price P, in dollars, to time t, in years, where t = 1 corresponds to 1988. Use a cubic function fitted to the data to predict the price of an electric guitar in 1997. Average price, p, 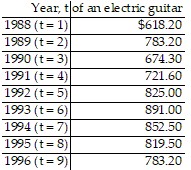
A. $670.48 B. $893.53 C. $827.42 D. $443.52