Compared with 1929, recent income distribution figures in the United States show
A. much greater equality.
B. less equity.
C. greater equity.
D. slightly less inequality.
Answer: D
You might also like to view...
The production possibilities frontier is a graph showing the
A) exact point of greatest efficiency for producing goods and services. B) tradeoff between free lunches. C) maximum combinations of goods and services that can be produced. D) minimum combinations of goods and services that can be produced. E) resources available for the economy's production use.
According to the Ricardian view of government deficits,
A. any future burden of tax financing should be ignored. B. government deficits reduce interest rates. C. taxpayers are less capable of saving when debt finance is used rather than tax finance. D. the private sector supply of loanable funds will increase in the face of government deficits.
Assume that goods X and Y are substitutes and are produced in perfectly competitive markets. All else constant, in the short run, a decrease in the supply of good X would cause:
A) an increase in the demand for good Y. B) a decrease in the demand for good Y. C) an increase in the supply of good Y. D) a decrease in supply of good Y.
Refer to the accompanying figure. An increase in demand is represented by a shift from: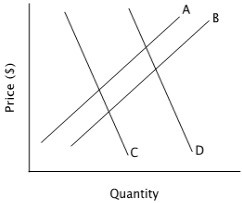
A. curve A to curve B. B. curve D to curve C. C. curve C to curve D. D. curve B to curve A.