Make a bar graph to represent the data.The following table shows the number of female infants born at Hospital X on New Year's Day (Jan. 1). Create a vertical bar graph.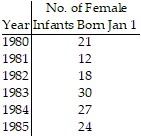
What will be an ideal response?
Answers may vary. A possible answer follows.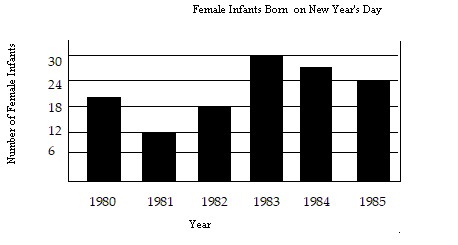
You might also like to view...
Find all the second order partial derivatives of the given function.f(x, y) = ex/y
A.  =
=  ;
;  =
=  ;
;  =
=  =
= 
B.  =
=  ;
;  = ex/y
 ;
;  =
=  = -ex/y
C.  =
=  ;
;  = -ex/y
 ;
;  =
=  = ex/y
D.  =
=  ;
;  = ex/y
 ;
;  =
=  = -ex/y
Find the open intervals on which the function is increasing and decreasing. Identify the function's local and absolute extreme values, if any, saying where they occur.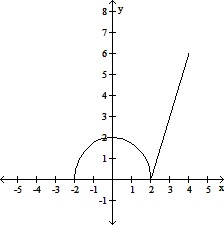
A. increasing on (-2, 0) and (2, 4); decreasing on (0, 2); absolute maximum at (4, 6); local maximum at (0, 2); absolute minimum at (-2, 0) and (2, 0) B. increasing on (-2, 0) and (2, 4); decreasing on (0, 2); absolute maximum at (4, 6) and(0,2); absolute minimum at (-2, 0) and (2, 0) C. increasing on (2, 4); decreasing on (0, 2); absolute maximum at (4, 6); local maximum at (0, 2); absolute minimum at (-2, 0) and (2, 0) D. increasing on (-2, 0) and (2, 4); decreasing on (0, 2); absolute maximum at (4, 6); absolute minimum at (-2, 0) and (2, 0)
Solve.There are 60 students in Jose's class.  of the students are science majors. How many students are science majors?
A. 60 students B. 48 students C. 12 students D. 10 students
Find the prime factorization of the number.126
A. 2 ? 2 ? 3 ? 3 ? 7 B. 2 ? 3 ? 3 ? 7 C. 2 ? 3 ? 7 D. 14 ? 3 ? 3