Provide an appropriate response.The bar graph shows the average student loan debt, in thousands of dollars, carried by bachelor's degree recipients for five selected class years in a certain state.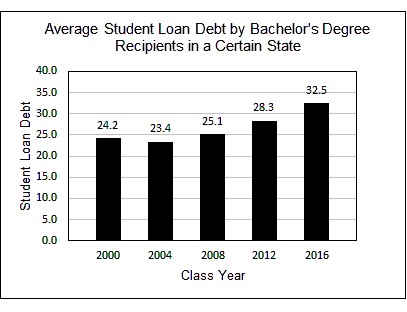 The mathematical model that approximates the data displayed by the bar graph is D = 0.6n + 22.5,
  is the average student loan debt, in thousands of dollars, and n is the number of class years after 2000.a) According to the mathematical model, what was the average student loan debt, in thousands of dollars, for the 2016 class year?b) Does your
answer in part (a) underestimate or overestimate the average student loan debt shown bythe bar graph? By how much, expressed as a decimal in thousands of dollars?c. Write the average student loan debt shown by the bar graph for the class of 2016 in standard form.
What will be an ideal response?
a) $32.1 thousand, b) underestimates by $0.4 thousand, c) $32,500
You might also like to view...
Provide an appropriate response.If f(x) = 3x - 1, find 
Fill in the blank(s) with the appropriate word(s).
Use an integer or rational number to express the number representing change.A football team lost 24 yards on one play.
A. 24 B. -24
Solve the equation. = 17
= 17
A. 288 B. 144 C. -144 D. 72
Determine the upper and lower bounds on the zeros of the given function.g(x) = 5x4 - 9x2 + 3
A. upper bound: 1; lower bound: -2 B. upper bound: 2; lower bound: -1 C. upper bound: 1; lower bound: -1 D. upper bound: 2; lower bound: -2