The following double-bar graph illustrates the revenue for a company for the four quarters of the year for two different years. Use the graph to answer the question.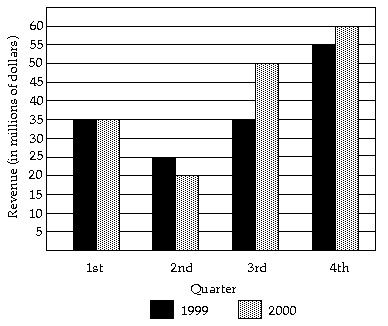 What was the difference in revenue between the third quarter of 1999 and the third quarter of 2000?
A. $1 million
B. $5 million
C. $15 million
D. $3 million
Answer: C
You might also like to view...
Solve the problem. Use a calculator with an LN or a LOG key.An earthquake was recorded with an intensity which was  times more powerful than a reference level earthquake, or
  What is the magnitude of this earthquake on the Richter scale (rounded to the nearest tenth)? The magnitude on the Richter scale of an earthquake of intensity I is
A. 3.7 B. 4.7 C. 0.5 D. 10.8
Solve the triangle. Round lengths to the nearest tenth and angle measures to the nearest degree.a = 8, b = 9, C = 123°
A. c = 14.9, A = 27°, B = 30° B. c = 20.7, A = 25°, B = 32° C. c = 17.8, A = 29°, B = 28° D. no triangle
Determine if the fraction is in lowest terms. If not, find a common factor of the numerator and denominator (other than 1).- 
A. no, 11 is a common factor B. no, 18 is a common factor C. no, -1 is a common factor D. yes
Using the definitions of "divisible" and "factor," answer the given question.Is 63 divisible by 7?
A. Yes B. No