Plot and interpret the appropriate scatter diagram.The one-day temperatures for 12 world cities along with their latitudes are shown in the table below. Make a scatter diagram for the data. Describe what happens to the one-day temperatures as the latitude increases.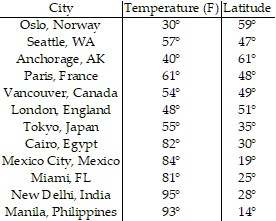 Latitude (degrees)
 Temperature (F)°
What will be an ideal response?
Latitude (degrees)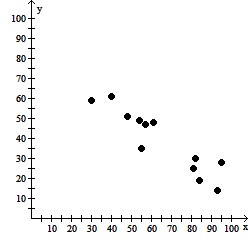
Temperature (F)°
As the latitude increases, the one-day temperatures decrease.
You might also like to view...
Solve.The square garden in the figure measures x yards on each side. The garden is to be expanded so that one side (the top of the figure) is increased by 3 yards and the adjacent side (the right side of the figure) is increased by 2 yards. Write a polynomial in descending powers of x that expresses the area of the larger garden. Then use the polynomial to determine the area of the larger garden if the original garden measures 5 yards on a side. 
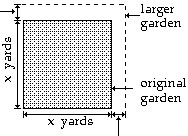 2 yards
A. x2 + 5x + 6; 30 square yards B. x2 + 5; 30 square yards C. x2 + 5; 56 square yards D. x2 + 5x + 6; 56 square yards
Determine which diagram is shaded to represent the given fraction.
A. 
B. 
C. 
D. 
Evaluate.52
A. 36 B. 32 C. 10 D. 25
Evaluate the discriminant, and predict the type and number of solutions.s2 - 2s + 6 = 0
A. 20, two different irrational B. 0, one rational C. -20, two different imaginary D. 20, two different rational