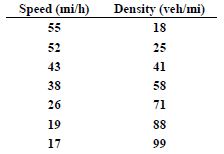
If speed and density observations give the data shown below, develop an appropriate expression for speed versus density for this highway, and determine the density at which the maximum volume will occur as well as the value of the maximum volume. Also plot speed versus density and volume versus speed for both the expression developed and the data shown. Comment on the differences between the two sets of curves.
Results of traffic flow studies on a highway indicate that the flow-density
relationship can be described by the expression:

What will be an ideal response?
Note that the given traffic flow relationship,
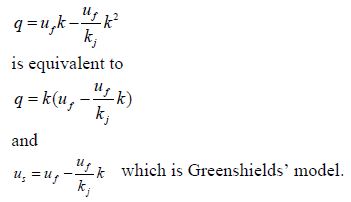
A linear regression model takes the form y = a + bx; therefore, in this case, the
given data us and k correspond to y and x respectively, while a = uf and b = uf/kj.
The linear regression analysis can be performed using Equations 6.28, 6.29, and
6.30, or using a computer software spreadsheet package. Linear regression
analysis yields values of a = 63.949 and b = –0.4941. Therefore,
a) mean free flow speed, uf
uf = a = 63.9 mi/h
jam density, kj
uf / kj = b = –0.4941
kj = 63.9 / 0.4941 = 129.33
jam density, kj = 129.33 veh/mi
b) density at maximum volume
State flow in terms of density.
Take the derivative and set equal to zero to maximize flow; solve for
density.
0 = 63.9 – 0.9882k
k = 64.66 veh/mi when q = qmax
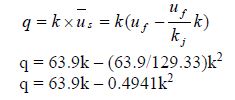
Solve for q
q = 63.9(64.66) – 0.4941(64.66)2
q = 2066 veh/hr
(a) maximum volume, qmax = 2066 veh/h
(b) density at maximum volume, k = 65 veh/mi
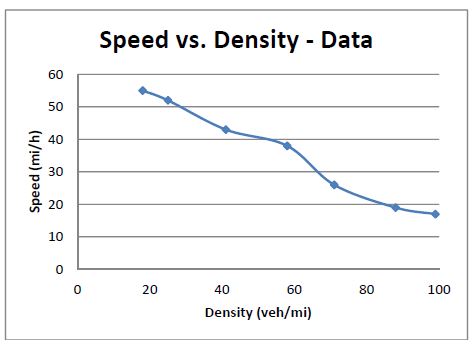
(c) Plot speed vs. density for data points and equation
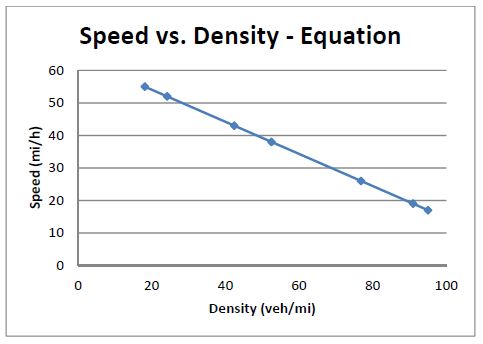
(d) Comment on the differences between the two curves.
The equation used to describe the speed-density relationship is linear, thereby
yield a straight-line relationship as shown above. The data follow an
approximately linear relationship, the extent of which could be quantified using
the R2 value that would be obtained through regression analysis or by calculating
the sum of squared errors (SSE) between the equation and the data points.
You might also like to view...
How much voltage is generally available to fuel injectors?
A) 10 Volts DC B) 5 Volts DC C) 7 Volts DC D) Battery voltage
How is the piezo stack in a EHI linked to the control valve?
A. Directly with a piston. B. By a fuel-charged hydraulic coupler. C. By the injector spindle. D. Using a fuel charged duct.
You should not back a tractor under a trailer until the air system is:
a. Empty. b. Between 60 and 80 psi. c. At normal pressure.
In the above diagram if a is 8 bricks and b is 9 bricks, what is the measurement of d to the nearest whole inch?
What will be an ideal response?