As the price of a good increases, the change in the quantity demanded can be shown by
A) shifting the demand curve leftward.
B) shifting the demand curve rightward.
C) moving down along the same demand curve.
D) moving up along the same demand curve.
D
You might also like to view...
In 2012, real GDP in the United States was below potential GDP. This fact definitely means that
A) the unemployment rate was near 10 percent. B) the unemployment rate was above the natural unemployment rate. C) the economy was in an expansion. D) cyclical unemployment had been decreasing. E) frictional unemployment was negative.
A stock person who is laid off by a department store because retail sales across the country have decreased is _______ unemployed.
A. Frictionally B. Structurally C. Cyclically D. Chronically
The text compares the macroeconomic performance of Great Britain and France immediately following Great Britain's departure from the ERM in 1992. What does it conclude?
A) The rate of growth of real GDP was higher in France than in Great Britain. B) The rate of growth of real GDP was lower in France than in Great Britain. C) The rates of growth of real GDP were equal in France and in Great Britain. D) GDP growth of both Great Britain and France increased dramatically after Great Britain withdrew from the ERM.
Using Figure 1 above, if the aggregate demand curve shifts from AD2 to AD3 the result in the long run would be: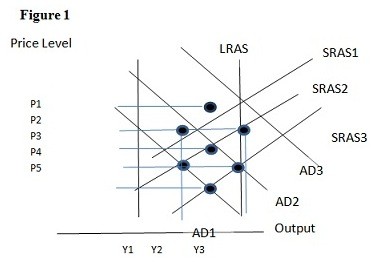
A. P2 and Y2. B. P1 and Y2. C. P4 and Y2. D. P1 and Y1.