The graph of a certain function y = f(x) and the zero of that function is given. Using this graph, find a) the x-intercept of the graph of y = f(x) and b) the solution to the equation f(x) = 0.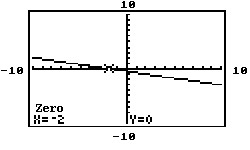
A. a. -1
b. x = -1
B. a. -2
b. x = 0
C. a. -2
b. x = -2
D. a. 0
b. x = -2
Answer: C
You might also like to view...
Solve the problem.If  f(x) = L, which of the following expressions are true? I.
  f(x) does not exist. II.
  f(x) does not exist. III.
  f(x) = L IV.
  f(x) = L
A. II and III only B. I and II only C. III and IV only D. I and IV only
Compute the average rate of change of f from x1 to x2. Round your answer to two decimal places whenappropriate. Interpret your result graphically.f(x) =  , x1= 1 and x2= 3
A. 0.71; the slope of the line passing through (1, f(1)) and (3, f(3)) is 0.71. B. 0.58; the slope of the line passing through (1, f(1)) and (3, f(3)) is 0.58. C. -0.58; the slope of the line passing through (1, f(1)) and (3, f(3)) is -0.58. D. -0.71; the slope of the line passing through (1, f(1)) and (3, f(3)) is -0.71.
Simplify the exponential expression. Write any negative exponents as positive exponents. Assume all variables represent positive real numbers.(-27)4/3
A. -81 B. 81 C. not a real number D. 729
Determine whether the pair of lines is parallel, perpendicular, or neither. 3x - 4y = -3 8x + 6y = -3
A. Parallel B. Perpendicular C. Neither