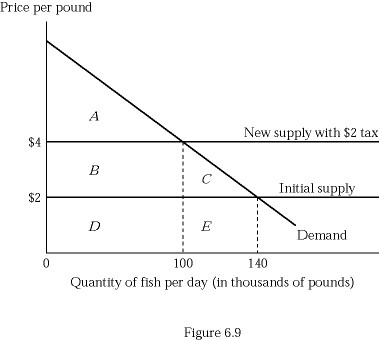
 Figure 6.9 depicts a hypothetical fish market with a horizontal supply curve. The consumer surplus at the new equilibrium with $2 tax is shown by:
A. Triangle A.
B. Triangle A + Rectangle B.
C. Rectangle B + Triangle C.
D. Triangle C + Rectangle E.
Answer: A
You might also like to view...
The first antitrust law passed was the ________
A) Federal Trade Commission Act B) Sherman Act C) Clayton Act D) Robinson-Patman Amendment
Buyers and sellers receive signals from markets
A) by listening to the TV news programs. B) through the price system. C) from the gossip columns in the newspapers. D) from their friends and acquaintances.
An increase in demand coupled with an increase in supply results in a(n)
a. increase in price and an ambiguous effect on equilibrium quantity b. increase in equilibrium quantity and a decrease in equilibrium price c. decrease in equilibrium quantity and an ambiguous effect on equilibrium price d. increase in economic rent e. ambiguous effect on equilibrium price and an increase in equilibrium quantity
Refer to the accompanying table. Pat's opportunity cost of making a pizza is delivering: Pizzas Made Per HourPizzas Delivered Per HourCorey126Pat1015
A. 2 pizzas. B. 3/2 of a pizza. C. 3 pizzas. D. 2/3 of a pizza.