Use the below axes to draw a supply and demand diagram that illustrates the long-run situation in agriculture. Explain the problem
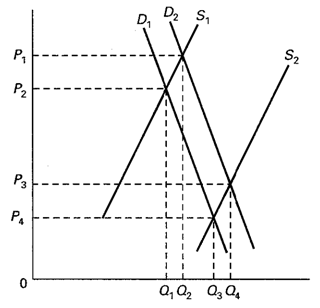
The graph shows that over time the supply of agricultural products has increased (from S1 to S2) more than the demand (from D1 to D2) for agricultural products. The price of farm products falls from P2 to P3 as output increases from Q1 to Q4. A rapid rate of technological advance and large increases in productivity because of capital investment and education largely explain the large supply increase. Demand has lagged because demand for farm products is income inelastic and the increase in population has not kept pace with the increasing supply.
You might also like to view...
What is product differentiation? What market structure is characterized by product differentiation?
What will be an ideal response?
Results of the ultimatum game indicate that most people value fairness enough that they will refuse to participate in a transaction they consider unfair, even if they are worse off financially as a result
Indicate whether the statement is true or false
When drawn against the real interest rate, the output supply curve unambiguously shifts to the right if
A) current capital decreases. B) current total factor productivity decreases. C) future total factor productivity decreases. D) current or future taxes increase.
Which of the following was a major consideration that underlay the establishment of the European Economic Community?