Refer to the table below. What is the expected price of the input in Country B?
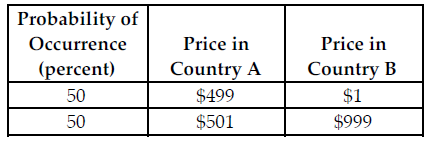
The above table provides the probability distribution of price of an input next year in Country A and Country B.
A) $1 B) $999 C) $501 D) $500
D) $500
You might also like to view...
Industrial production, total sales, nonfarm employment, and after-tax household income are examples of ________ indicators of economic activity.
A. coincident B. real C. preceding D. lagged
A cost imposed on people other than the consumers of a good or service is a:
a. price floor. b. negative externality. c. price ceiling. d. positive externality.
Using Figure 1 above, if the aggregate demand curve shifts from AD3 to AD2 the result in the short run would be: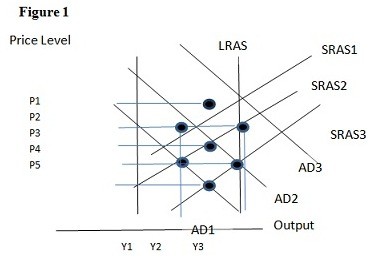
A. P3 and Y1. B. P2 and Y1. C. P2 and Y3. D. P1 and Y2.
 Refer to Figure 6.3. If the market is in equilibrium, the total surplus is:
A. area ABC. B. area BCD. C. zero. D. area ACD.