Consider the following bar graph. How many barrels of oil per day were used by Japan?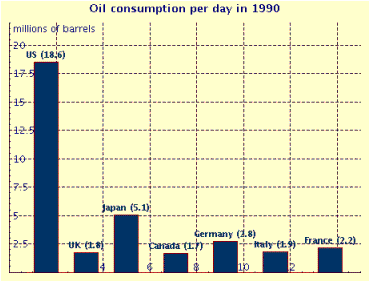
A. 1.8 million barrels
B. 5.1 million barrels
C. 0.51 million barrels
D. 10.6 million barrels
E. 2.2 million barrels
Answer: B
You might also like to view...
Find numbers a and b, or k, so that f is continuous at every point.


A. a = 7, b = 35 B. a = -35, b = 14 C. a = 7, b = -7 D. Impossible
Restate in a logically equivalent form.It is not true that today I both went to school and read a book.
A. Today, I read a book but did not go to school. B. Today, I either did not go to school or I did not read a book. C. Today, I did not read a book and did not go to school. D. Today, I went to school and read a book.
Write out the first five terms of the sequence.an = 3n- 3
A. 0, 3, 6, 9, 12 B. 0, -3, -6, -9, -12 C. 0, 1, 2, 3, 4 D. 6, 9, 12, 15, 18
Use a graphing calculator to plot the data and find the quadratic function of best fit.The following table shows the median number of hours of leisure time that Americans had each week in various years. Use x = 0 to represent the year 1973. Using a graphing utility, determine the quadratic regression equation for the data given. What year corresponds to the time when Americans had the least time to spend on leisure?
What will be an ideal response?