This graph shows the marginal cost and marginal benefit associated with roadside litter clean up. Assume that the marginal benefit curve and marginal cost curve each have their usual slope.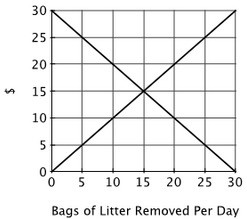 The socially optimal number of bags of litter removed from the roadside each day is:
A. 15.
B. 10.
C. 20.
D. 30.
Answer: A
You might also like to view...
Refer to Figure 13-1. Ceteris paribus, a decrease in the value of the domestic currency relative to foreign currencies would be represented by a movement from
A) AD1 to AD2. B) AD2 to AD1. C) point A to point B. D) point B to point A.
The difference between a firm's revenue and its operating expenses is the firm's operating income
Indicate whether the statement is true or false
Which of the following is the least likely take place if the Fed responds to a negative demand shock by reducing the real interest rate?
A) IS shifts to the right B) output gap returns to zero C) inflation returns to its previous rate D) MP shifts down
The change in fixed costs over the short run is seen in the behavior of marginal costs
Indicate whether the statement is true or false