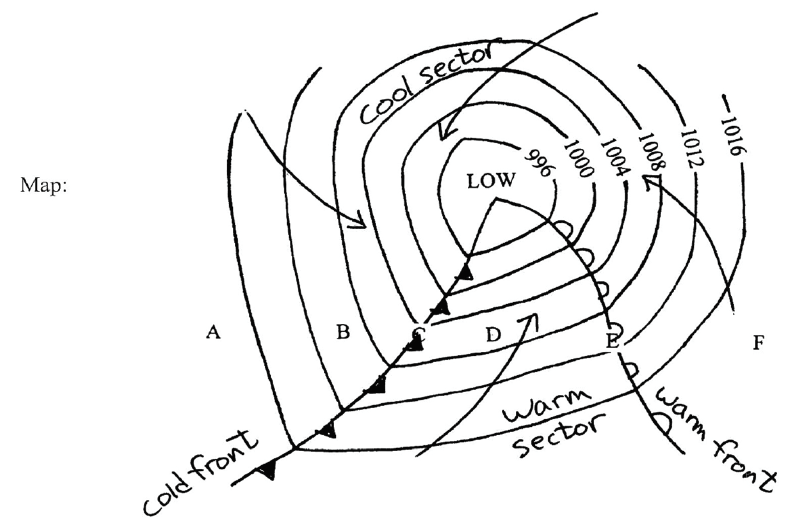
At point D, is the pressure rising or falling? Why?
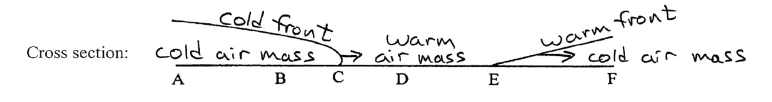
The question is based on this hypothetical weather map in the Northern Hemisphere showing isobars and the positions of a cold front and a warm front (top of map is north). Six locations are marked on the map (points A, B, C, D, E, and F). A cross-section diagram along points A, B, C, D, E, and F is shown below the map.
What will be an ideal response?
Falling (decreasing). Trough along cold front is approaching.
You might also like to view...
Which of the following clouds is characterized as a middle cloud?
A. cirrocumulus B. cumulonimbus C. stratocumulus D. altostratus
Ocean surface currents
A) initiate Ekman transport. B) flow at a 90 degree angle away from the prevailing winds. C) are warmest in midlatitude waters. D) are not involved in La Niña events. E) are typically colder than the water 500 meters below.
Examine the changes in electrical demand in the United States. The daily drop in electrical consumption is most closely associated with ________
A) people sleeping B) home heating and cooling systems C) people heading off to work D) daytime activities that consume little energy
The greatest wind speeds occur in the center of jet streams, with velocities decreasing away from the center.
a. true b. false