Answer the question.Describe how the graph of y = x2 - 2 may be obtained from the graph of y = x2.
A. Shift 2 units to the left.
B. Shift 2 units up.
C. Shift 2 units down.
D. Shift 2 units to the right.
Answer: C
Mathematics
You might also like to view...
Find the median for the given values.75, 49, 206, 116, 268, 239, 232
A. 116 B. 206 C. 169 D. 232
Mathematics
Change to an improper fraction.4
A. 
B. 
C. 
D. 
Mathematics
Find the equation of the curve for the given slope and point through which it passes.Slope given by -3y + e-x; passes through (0, 4)
A. y = e-x + 3x + 3 B. 2y = e-x + 7e-3x C. 2y = e-x + 7ex D. 2y = e-x + 7e3x
Mathematics
Use the pictograph to answer the question.This pictograph shows projected sales of compact disks (CDs) for a popular rock band for seven consecutive years. 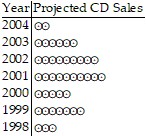 ? = 10,000 CDsIn which year will the greatest number of CDs be sold?
A. 2001 B. 2004 C. Not enough information is given. D. 1999
Mathematics