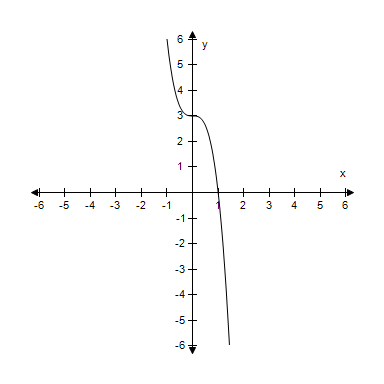
Graphically estimate the x- and y-intercepts of the graph.
?

?
?
A. x-intercept: (0, 1)y-intercept: (0, 3)
B. x-intercept: (1, 0)y-intercept: (3, 0)
C. x-intercept: (0, 1)y-intercept: (3, 0)
D. x-intercept: (1, 0)y-intercept: (0, 3)
E. x-intercept: (1, 0)y-intercept: (0, -3)
Answer: D
You might also like to view...
Evaluate the expression.24
A. 16 B. 5 C. 8 D. 6
Solve the problem.The grading scale for a C in Amy's biology class is an average on tests between 70% and 80%, inclusive. Amy has 66%, 83%, and 75% on the first three tests this semester. What range of scores on the fourth test would give her a C?
A. Between 70% and 80%, inclusive B. Between 61% and 91%, inclusive C. 91% or better D. Between 56% and 96%, inclusive
Evaluate the expression for the given replacement values.xy for x = 5, y = -2
A. -10 B. 7 C. 10 D. 3
Convert.6.87 meters = _____ hectometer
A. 687 B. 0.687 C. 0.0687 D. 68.7