The following comparison line graph indicates the number of vehicles sold for a seven week period by two different salespeople. Use the graph to answer the question.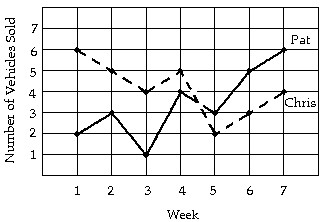 How many more vehicles did Chris sell in the first week than Pat in the first week?
A. 4 vehicles
B. 2 vehicles
C. 3 vehicles
D. 6 vehicles
Answer: A
Mathematics
You might also like to view...
Write an equation of the line through the given point with the given slope. Write the equation in slope-intercept form.(0, -9); m = 5
A. y = 5x + 9 B. y = 5x - 9 C. y = -5x - 7 D. y = 5x + 11
Mathematics
Multiply.0.05 × 0.8
A. 0.4 B. 4 C. 0.04 D. 0.004
Mathematics
Solve the system by the substitution method.2x2 + 4y2 = 36y = x + 3
A. 
B. 
C. 
D. 
Mathematics
Find the midpoint of the segment with the given endpoints.(-5, 9 ) and (7, -5
 )
)
A. 
B. 
C. 
D. 
Mathematics