Refer to the information provided in Figure 6.5 below to answer the question(s) that follow.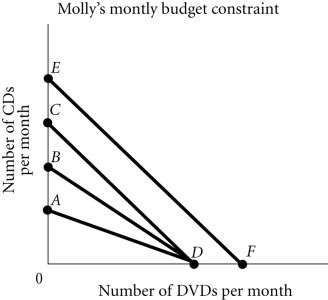 Figure 6.5Refer to Figure 6.5. Molly's budget constraint is AD. If the price of CDs decreases, her new budget constraint becomes
A. AE.
B. BD.
C. AO.
D. EF.
Answer: B
You might also like to view...
Between 1955 and 2006, the federal government purchases of goods and services as a percentage of GDP has:
a. generally trended downward b. Not changed. c. Grown by about 10%. d. Tripled.
If a price floor of $23 were placed in the market in the graph shown:
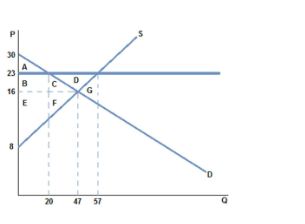
A. a shortage of 37 would occur.
B. a shortage of 10 would occur.
C. a shortage of 27 would occur.
D. None of these would occur.
The curve that shows the relationship between the price of a good and the quantity that consumers are willing to purchase at each price is the
a. supply curve. b. demand curve. c. production possibilities curve. d. consumption curve.
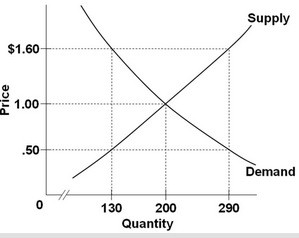 Refer to the above diagram. A surplus of 160 units would be encountered if price was:
A. $.50. B. $1.10, that is, $1.60 minus $.50. C. $1.00. D. $1.60.