Determine whether the graph represents a function.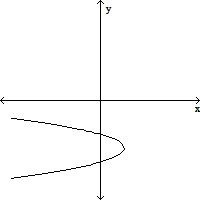
A. Not a function
B. A function
Answer: A
You might also like to view...
Evaluate.cot2 45° + sin 150° + 4 tan2 45°
A. 
B. 
C. 
D. 
Solve the problem.The function f(t) = -0.12t2 + 0.53t + 30.4 models the U.S. population in millions, ages 65 and older, where t represents years after 1990. The function g(t) = 0.53t2 + 11.9t + 106.4 models the total yearly cost of Medicare in billions of dollars, where t represents years after 1990. What does the function  represent? Find
  (10).
(10).
A. Cost per person in thousands of dollars. $11.75 thousand B. Cost per person in thousands of dollars. $9.94 thousand C. Cost per person in thousands of dollars. $0.09 thousand D. Cost per person in thousands of dollars. $0.17 thousand
Use a graphing calculator to solve the system of equations. Round your solution to one decimal place.2.0x + 2.0y - 5.0z = 1.25.0x - 3.4y - 1.8z = -3.12.6x - 4.7y - 3.8z = 9.2
A. (-12.7, -8.9, -9.8) B. (-2.5, -1.8, -2.0) C. (-10.1, -7.1, -7.8) D. (-5.1, -3.5, -3.9)
Provide an appropriate response.True or false? If k = 0, then x2 = k will have exactly one real solution. If false, give the correct number of real solutions.
A. False; three B. False; two C. False; zero D. True