This graph shows the cost and revenue curves faced by a monopoly. 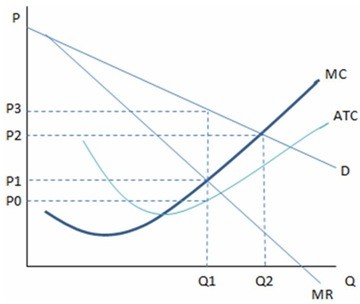 According to the graph shown, if Q2 units are being produced, this monopolist:
A. should cut back production to increase profits.
B. is maximizing profits.
C. is maximizing revenue.
D. is earning negative profits.
Answer: A
You might also like to view...
To maximize profit, a firm will produce the level of output where MR = MC. If a firm actually makes a profit depends on the relationship of price to average total cost
What are the three possible relationships between price and average total cost that determine if a firm will make a profit, experience a loss, or break even?
Other things being equal, a rise in a country's terms of trade increases its welfare. What would happen if we relax the ceteris paribus assumption, and allow for the law of demand to operate internationally?
What will be an ideal response?
The leader of a federal political party made the following campaign promise: "My administration will improve welfare by increasing national defense without requiring sacrifices elsewhere in the economy." This is an example of a positive statement
a. True b. False Indicate whether the statement is true or false
Fama and Jensen suggest that "the form of organization that survives in an activity is the one that delivers the product demanded by customers at the lowest price while covering costs." This is an example of
A. defective organizational architecture. B. market and organizational efficiency. C. economic benchmarking. D. market and organizational equity.