Refer to the diagram. Assume that for the entire business sector of a private closed economy there is $0 worth of investment projects that will yield an expected rate of return of 25 percent or more. But there are $15 worth of investments that will yield an expected rate of return of 20- 25 percent; another $15 with an expected rate of return of 15-20 percent; and similarly an additional $15 of investment projects in each successive rate of return range down to and including the 0-5 percent range. Which of the lines on the diagram represents these data?
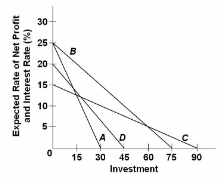
A. A.
B. B.
C. C.
D. D.
B. B.
You might also like to view...
A change in the price level changes the amount of nominal money people demand
Indicate whether the statement is true or false
At what level of output will average variable cost equal average total cost?
a. when marginal cost equals average total cost b. for all levels of output in which average variable cost is falling c. when marginal cost equals average variable cost d. There is no level of output where this occurs, as long as fixed costs are positive.
In general, the larger the membership of a union the:
A. less power it has to keep wages above equilibrium. B. more likely the distribution of power within the organization will make it less effective. C. greater the chance that it abuses its power. D. more power it has to keep wages above equilibrium.
Which of the following is the correct formula for the marginal propensity to consume?
A. MPC = 1 ÷ (1 - MP B. MPC = (total consumption) ÷ (total disposable income). C. MPC = 1 - MPS. D. MPC = (change in consumption) + (change in disposable income).