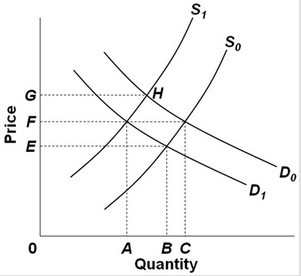
 Refer to the above diagram, which shows demand and supply conditions in the competitive market for product X. A shift in the demand curve from D0 to D1 might be caused by a(n):
A. increase in the price of substitute product Y.
B. decrease in income if X is an inferior good.
C. increase in the price of complementary good Y.
D. increase in money incomes if X is a normal good.
Answer: C
You might also like to view...
Answer the next question based on the following data. All figures are in billions of dollars.Gross investment$18Net exports2Residential fixed investment5Inventory investment3Net investment13Consumption (depreciation) of fixed capital is ________.
A. $5 B. $15 C. $13 D. $16
Use the following figure to answer the next question.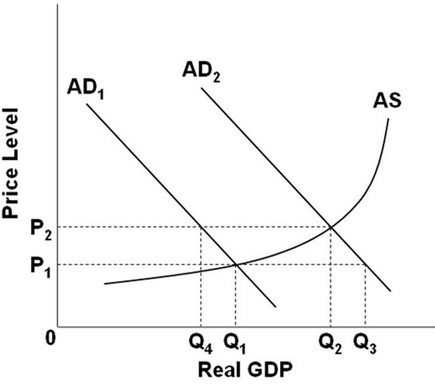 Suppose the economy is currently at full employment with aggregate demand curve AD2. A further increase in consumption and investment spending will cause ________.
A. demand-pull inflation, and the new equilibrium output will be more than Q2 B. cost-push inflation, and the new equilibrium output will be less than Q2 C. demand-pull inflation, and the new equilibrium output will be less than Q2 D. cost-push inflation, and the new equilibrium output will be more than Q2
Becoming a monopoly by controlling a scarce resource is ______.
a. the most common method to gain monopoly status b. an illegal entry barrier to maintain monopoly status c. a very rare way to gain monopoly status d. the most affordable way to gain monopoly status
Explain why the ratio of assets to capital increased dramatically for commercial banks from the 1960s to the present.
What will be an ideal response?