Use a graphing calculator to plot the data and find the quadratic function of best fit.The number of housing starts in one beachside community remained fairly level until 1992 and then began to increase. The following data shows the number of housing starts since 1992 (x = 1). Use a graphing calculator to plot a scatter diagram. What is the quadratic function of best fit?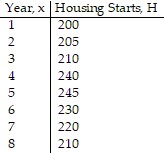
A. H(x) = -2.679x2 - 26.607x + 168.571
B. H(x) = 2.679x2 + 26.607x + 168.571
C. H(x) = -2.679x2 + 26.607x - 168.571
D. H(x) = -2.679x2 + 26.607x + 168.571
Answer: D
You might also like to view...
Write an equivalent double integral with the order of integration reversed.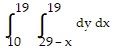
A. 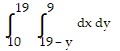
B. 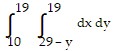
C. 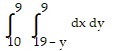
D. 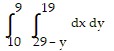

Answer the following statement true (T) or false (F)
Solve the problem.A searchlight is shaped like a parabola. If the light source is located 3 feet from the base along the axis of symmetry and the opening is 8 feet across, how deep should the searchlight be?
A. 4 ft B. 1.3 ft C. 5.3 ft D. 0.6 ft
Use a proportion to solve the problem.On a map of the Fox River, 1 centimeter represents 2.5 kilometers. If a trail by the river is actually 10.00 kilometers long, what is the length of the trail on the map?
A. 4.0 cm B. 2.5 cm C. 6 cm D. 7.5 cm