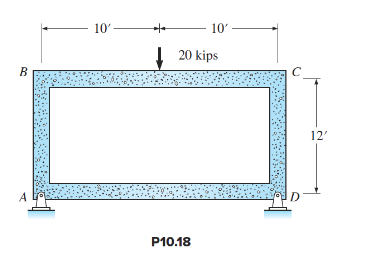
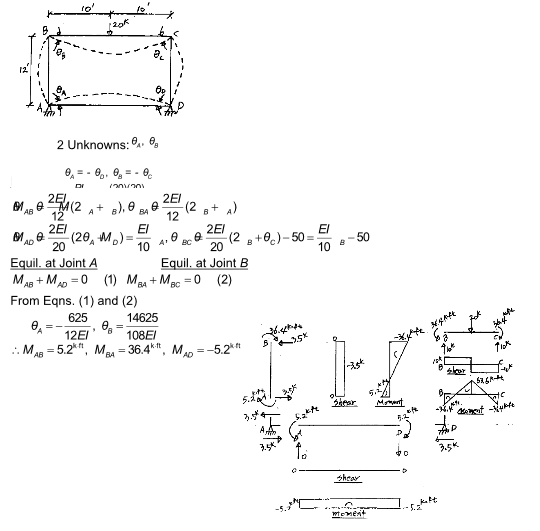
Analyze the frame in Figure P10.18. Compute all reactions. Given: EI is constant.
You might also like to view...
Control limits are best described as:
a. the highest point established as the top specification on a control chart. UCL X-bar = Average X-bar + (A2 X Average R). b. boundaries that tell you if the process is in control. c. a cause of variation or special cause. d. the lowest point established as the bottom specification on a control chart. LCL X-bar = Average X-bar – (A2 X Average R).
A right triangle has one side of 5 and another side of 4 (neither side is the hypotenuse). What is the angle adjacent to the side that is 5?
A. 10.87° B. 15.34° C. 18.13° D. 38.66°
How often must a refillable refrigerant cylinder be tested?
A. Every 3 years B. Every 4 years C. Every 5 years D. Every 6 years
Draw the power triangle for the combined load.
What will be an ideal response?