Which of the following is the best interpretation of the graph below of mussel size (X-axis) versus energy gain (line graph, left Y-axis), and number of mussels eaten per day (histogram, right Y-axis)?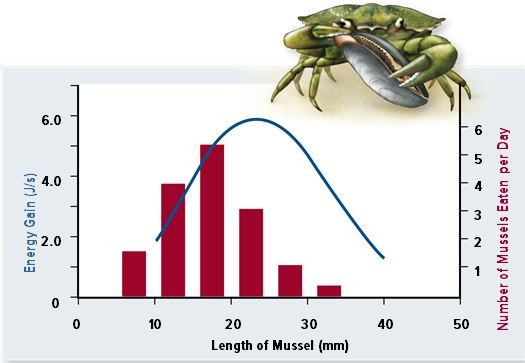
A. Crabs tend to consume most of the largest mussels.
B. Crabs select mussels in a way that maximizes their energy gain.
C. Mussels are selected as food sources by crabs.
D. Mussel size does not seem to be a good predictor as to which mussel hungry crabs will select.
E. Crabs prefer the mussels with the smallest length for their food resources.
Answer: B
You might also like to view...
Which of the following components of a virus is not encoded by its own DNA?
A. capsid B. lipid bilayer of viral envelope C. spike glycoproteins of viral envelope D. bacteriophage anchoring structures E. tail fibers
General type of reaction for the formation new biological material
a. Anabolism b. Respiration c. Catabolism d. Fermentation
Indicate the ploidy of each of the following cells:A
plant spores B. sperm C. somatic cells D. cells of a flower petal What will be an ideal response?
An aquatic microbe that can grow only near the surface of the water is probably which of the following?
A) a phototroph B) a heterotroph C) a chemotroph D) a lithotroph E) an anaerobe