The bar graph shows the increasing life expectancy of males in the United States from 1930 to 2010. Use this graph. In which of the years shown was the life expectancy of males in the United States approximately the same?
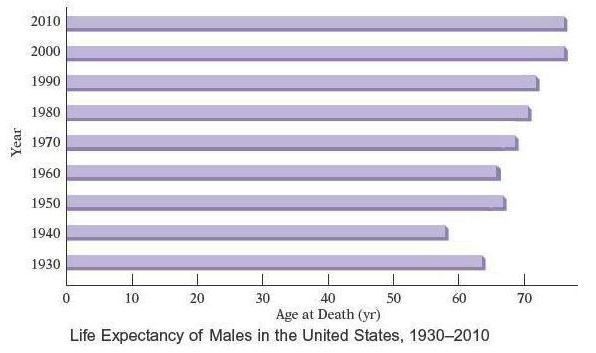
A) 2000 and 2010
B) 2010 and 2020
C) 1990 and 2000
D) 1980 and 2030
E) 2010 and 1990
A) 2000 and 2010
Health & Biomechanics
You might also like to view...
Find the least common multiple (LCM) of the numbers 8, 10.
A) 80 B) 2 C) 40 D) 1 E) 8
Health & Biomechanics
Which medication is used to dissolve existing blood clots?
A) anticoagulant B) hematinic C) thrombolytic D) antihemorrhagic
Health & Biomechanics
A loss or lack of the power of voluntary motion is called ________
Fill in the blank(s) with correct word
Health & Biomechanics
Nine times out of 10, who introduces illegal drugs to student users?
a. older siblings b. friends c. teachers d. someone they met off campus e. club owners
Health & Biomechanics