Refer to Figure 4-11. Suppose the market is initially in equilibrium at price P1 and then the government imposes a tax on every unit sold. Which of the following statements best describes the impact of the tax?
A) The consumer will bear a greater share of the tax burden if the demand curve is D2.
B) The consumer will bear a greater share of the tax burden if the demand curve is D1.
C) The consumer will bear the entire burden of the tax if the demand curve is D1 and the producer will bear the entire burden of the tax if the demand curve is D2.
D) The consumer's share of the tax burden is the same whether the demand curve is D1 or D2.
A
You might also like to view...
The growth of GDP may understate changes in the economy's economic well-being over time if the ________.
A. amount of leisure decreases B. quality of products and services improves C. environment deteriorates because of pollution D. distribution of income becomes increasingly unequal
Describe the argument that education generates a positive externality. Why might this externality not be relevant in terms of economic efficiency?
What will be an ideal response?
The above figure shows the payoff matrix for two firms, A and B, choosing to produce a basic computer or an advanced computer
Now the payoff of the firm who produces a basic computer falls to 10 if the other firm chooses to produce an advanced computer. Then A) both firms will have dominant strategies. B) Nash equilibria will not change. C) joint profits will be maximized at the Nash equilibrium. D) Firm A and firm B will choose different actions.
According to the graph shown, if this economy were open to free trade, domestic producers would produce how many units?
This graph demonstrates the domestic demand and supply for a good, as well as the world price for that good.
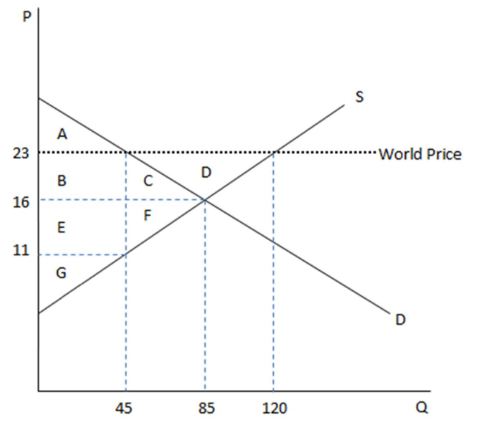
A. 45
B. 85
C. 120
D. 75