Refer to the information provided in Figure 2.4 below to answer the question(s) that follow.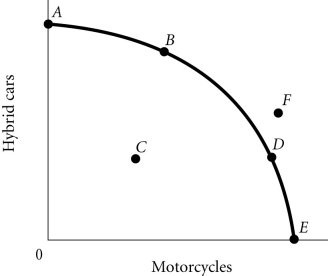 Figure 2.4According to Figure 2.4, Point F
A. is efficient and attainable.
B. cannot be produced with the current state of technology.
C. represents underallocation of resources.
D. represents what the people want.
Answer: B
You might also like to view...
When the total external and internal costs of a transaction are taken into consideration, this is known as
A) public costs. B) average total costs. C) social costs. D) marginal costs.
An individual labor-demand curve represents:
A. a worker's decisions around how many hours to work at each alternative wage. B. the decisions of all workers around how many hours to work at each alternative wage. C. a firm's decisions around how many hours to hire at each alternative wage. D. the decisions of all firms around how many hours to work at each alternative wage.
You are given the following gamble: behind one door is $500; behind another is $100; behind another is $0. What is the expected value of the gamble?
A. $200 B. $300 C. $600 D. We need more information in order to answer
When the selling price of a good rises (goes up), what is the relationship to the quantity supplied?
a. The profit made on each item goes down. b. It becomes practical to produce more goods. c. The cost of production goes down. d. There is no relationship between the two.