Solve the problem.Suppose that the function y = f(x) is decreasing on the interval (8, 2). What can be said about the graph of 
A. decreasing on (8, 2)
B. increasing on (-8, -2)
C. decreasing on (-8, -2)
D. increasing on (8, 2)
Answer: D
You might also like to view...
The graph below shows estimated world population for the period 4000 BC - 2000 AD. Note that the logarithm of the world population and not actual population is plotted on the vertical axis. This means, for example, that when the graph reaches 7 on the vertical scale, world population is 107 and when the graph reaches 9 on the vertical scale, world population is 109. Log World Population 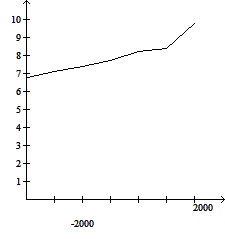 ? Year Use the graph to answer the question. How does world population in the year 2000 AD compare with world population in the year 4000 BC?
A. The 2000 AD population is roughly 44% larger than the 4000 BC population. B. The 2000 AD population is roughly three billion larger than the 4000 BC population. C. The 2000 AD population is roughly one thousand times as large as the 4000 BC population. D. The 2000 AD population is roughly thirty times as large as the 4000 BC population.
Find f"(x) for the function.f(x) =  4
4
A. 
 2 +
2 + 
 3
3
B. - 
 2 +
2 + 
 3
3
C. 12  2
2
D. - 
 3
3
Verify the identity.cos 3x = cos3 x - 3 sin2 x cos x
What will be an ideal response?
Find the equation of the line described. Write the equation in slope-intercept form, if possible.(-6, 6); slope = -4
A. y = -4x - 18 B. x = -4y + 18 C. y = -4x + 18 D. x = -4y - 18