Refer to the information provided in Figure 5.7 below to answer the question(s) that follow.
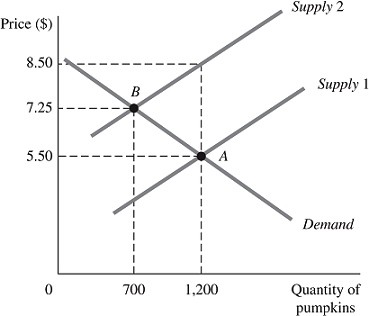 Figure 5.7The above figure represents the market for pumpkins both before and after the imposition of an excise tax, which is represented by the shift of the supply curve.Refer to Figure 5.7. The amount by which the store owners will raise the price of pumpkins after the imposition of the tax is ________ per pumpkin.
A. $1.25
B. $1.75
C. $3.00
D. $7.25
Answer: B
You might also like to view...
Before a market allocation of goods on the production possibilities curve can be judged efficient, one must evaluate “what” goods the market produced.
Answer the following statement true (T) or false (F)
Which of the following statements is true about the behavior of the CPI?
a. It has risen steadily since 1960. b. It has fallen steadily since 1960. c. It fell during the 1960s and has risen ever since. d. It rose sharply in the 1970s and then declined in the 1980s. e. It has risen and fallen with roughly equal frequency since 1960.
A year-long drought that destroys most of the summer's crops would be considered a:
A. short-run supply shock. B. long-run demand shock. C. long-run supply shock. D. short-run demand shock.
If the price elasticity of supply is elastic, which of the following could be a possible value of the elasticity?
A. 3 B. 1 C. 0.3 D. 0