Use the information given to draw a bar graph. Clearly label the bars. The following table shows the number of female infants born in a certain city on New Year's Day in various years. Make a vertical bar graph to illustrate the data.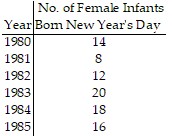
What will be an ideal response?
Answers may vary. The following is a possible answer.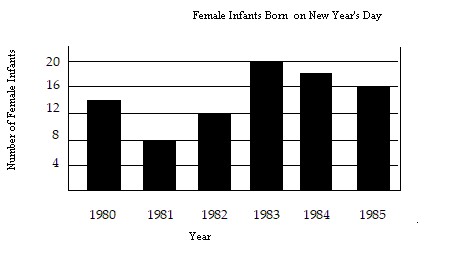
You might also like to view...
Write a chain rule formula for the following derivative. for w = f(x, y, z); x = g(r, s), y = h(t), z = k(r, s, t)
A.  =
= 

B.  =
=  +
+ 
C.  =
=  +
+ 
D.  =
= 
 +
+ 

Simplify the following radical expression.
 ?
?
A. 
B. 
C. 
D. 
E. 
There are initially 5.00 inches of snow on the ground. It begins snowing, and snow falls at a steady rate of 4.00 inches per hour.
?
?
A: Explain why the depth  , in inches, of snow on the ground is a linear function of the number of hours
  since the snowfall began.
?
B: Find a formula that gives the depth of snow on the ground after
since the snowfall began.
?
B: Find a formula that gives the depth of snow on the ground after  hours of snowfall.
?
C: Solve the equation you found in part
hours of snowfall.
?
C: Solve the equation you found in part  for
for  and explain in practical terms what this equation tells you.
What will be an ideal response?
and explain in practical terms what this equation tells you.
What will be an ideal response?
Determine all critical points for the function.f(x) = x3 - 12x - 5
A. x = 2 B. x = -2 C. x = -2 and x = 2 D. x = -2, x = 0, and x = 2