A table which shows the quantities of a particular good or service that consumers are willing to purchase at various prices is known as a:
A. demand schedule.
B. demand figure.
C. demand curve.
D. demand graph.
A. demand schedule.
You might also like to view...
Which of the following do NOT provide charters?
A) the Office of the Comptroller of the Currency B) the Federal Reserve System C) the National Credit Union Administration D) state banking and insurance commissions
In which of the following situations will the price of medical care decrease with an increase in its demand?
a. When the supply of medical care is the same as the demand for medical care b. When there is an increase in productivity as a result of a technological advancement c. When there is an increase in the price of resources used to produce medical care d. When the supply of medical care increases more than the demand for medical care e. When there is an increase in future profit expectations
Why is the demand for resources called a “derived” demand? On what two factors does the strength of the demand for resources depend? How are these two factors related?
What will be an ideal response?
Refer to the information provided in Figure 4.3 below to answer the question(s) that follow.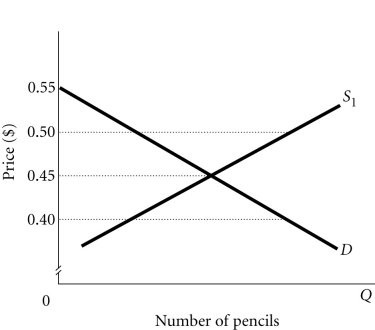 Figure 4.3Refer to Figure 4.3. An example of an effective price ceiling would be government setting the price of pencils at
A. $0.40. B. $0.45. C. $0.50. D. $0.55.