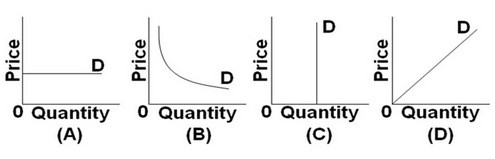
 Refer to the above graphs. A price increase from $20 to $40 causes quantity demanded to decrease from 100 units to 50 units. Which graph best illustrates the price elasticity of demand for this good?
A. Graph A
B. Graph B
C. Graph C
D. Graph D
Answer: B
You might also like to view...
What is pure rent?
What will be an ideal response?
Which of the following is true about rational expectations?
a. People form expectations on the basis of information about past as well as future actions of policy makers. b. Wage agreements do not reflect inflationary expectations if workers expect continued inflation c. Rational people cannot easily anticipate the effects of discretionary policy on the price level and output. d. The role of expectations is applicable in the context of monetary policy only. e. The effectiveness of a particular government policy is independent of people's expectations.
Which of the following is an example of U.S. foreign direct investment?
a. A Greek company opens a cheese factory in the U.S. b. A German mutual fund buys stock issued by a U.S. corporation. c. A U.S. beverage company opens a bottling plant in Russia. d. A U.S. bank buys bonds issued by an Argentinean company.
What is the most appropriate test to evaluate whether a government-spending program will improve living standards and lead to higher income levels?
What will be an ideal response?