Refer to the graph shown. From 1980 to 1985, the U.S. dollar appreciated over 60 percent. The effect of this appreciation on the AD curve can be shown by a movement from: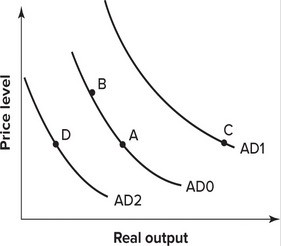
A. A to B.
B. A to C.
C. A to D.
D. B to A.
Answer: C
You might also like to view...
Refer to the information provided in Table 8.2 below to answer the question(s) that follow.
Table 8.2 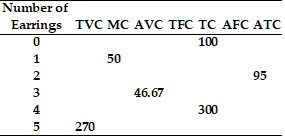 Refer to Table 8.2. If Sherry produces one pair of earrings, her total variable costs are
A. $50. B. $100. C. $150. D. indeterminate from this information.
A ________ system is one in which all possible trades that make some societal members better off without making others worse off have been exhausted.
A. general equilibrium B. Pareto optimal C. Pareto maximized D. market
The Clean Air Act and the Clean Water Act were originally passed in
A. the 1960s. B. the 1970s. C. the 1930s. D. the 1990s.
The various money supply measures (M1 and M2) are used to distinguish the
A. Speed with which banks transfer funds between themselves. B. Speed with which banks transfer funds between savings and checking accounts. C. Liquidity and accessibility of assets. D. Rate at which money flows through the economy.