Use the following graph to answer the next question. 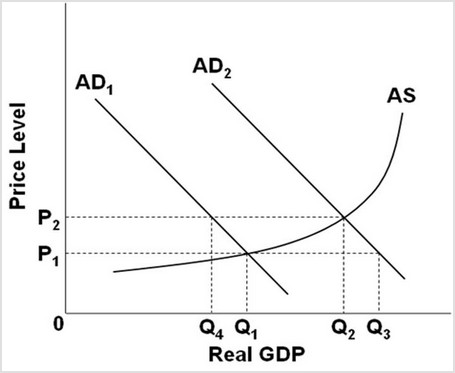 The massive increase in government spending during World War II moved the economy in the span of a few short years from mass unemployment and price stability to "overfull" employment. This situation can be best illustrated in the figure above as a ________.
A. shift from AD2 to AD1
B. movement along AD1 from Q4 to Q1
C. movement along AD2 from Q2 to Q3
D. shift from AD1 to AD2
Answer: D
You might also like to view...
The quantity supplied of a good or service is the
A) quantity produced at one price. B) one quantity produced at a variety of prices. C) list of all quantities at different prices, as illustrated by a supply schedule and a supply curve. D) list of all quantities at different prices, as illustrated by a demand schedule and a demand curve.
Refer to Figure 5.1. All else equal, an increase in total factor productivity will cause a
A) shift from PF1 to PF2. B) shift from PF2 to PF1. C) movement up and to the right along PF1. D) movement down and to the left along PF2.
One of the primary reasons tax withholding was instituted was _____
a. help speed up payments to the government b. decrease the government's record-keeping burden c. to improve the ability to audit individuals d. so that top marginal tax rates could be tripled
An economy's resources: a. include land, labor, capital, and entrepreneurial skills
b. are unlimited in a country like the United States. c. are always efficiently utilized in wealthy nations. d. consist of land, labor and capital, but not entrepreneurial skills.