Refer to the diagram, in which S 1 and D 1 represent the original supply and demand curves and S 2 and D 2 the new curves. In this market the indicated shift in supply may have been caused by:
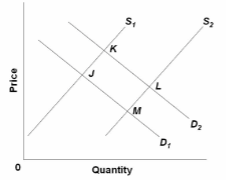
A. an increase in the wages paid to workers producing this good.
B. the development of more efficient machinery for producing this commodity.
C. this product becoming less fashionable.
D. an increase in consumer incomes.
B. the development of more efficient machinery for producing this commodity.
You might also like to view...
Given the scenario described, if the market price of hammers increased from $9 to $13:
Assume there are three hardware stores, each willing to sell one standard model hammer in a given time period. House Depot can offer their hammer for a minimum of $7. Lace Hardware can offer the hammer for a minimum of $10. Bob's Hardware store can offer the hammer at a minimum price of $13. A. House Depot's producer surplus would increase by $4. B. Lace Hardware Hardware's producer surplus would increase by $3. C. Bob's Hardware's producer surplus would remain unchanged. D. All of these statements are true.
An increase in the overall level of prices in an economy is referred to as
a. the income effect. b. inflation. c. deflation. d. the substitution effect.
The marginal tax rate refers to ______.
a. taxes applied to income from sources other than wages b. total taxes paid divided by total income c. the rate paid on the last dollar of income d. the smallest percentage of income a person has to pay in taxes
________ marginal returns implies ________ marginal costs.
A. Increasing; increasing B. Increasing; constant C. Diminishing; decreasing D. Diminishing; increasing