If the graph shown is displaying a competitive labor market:
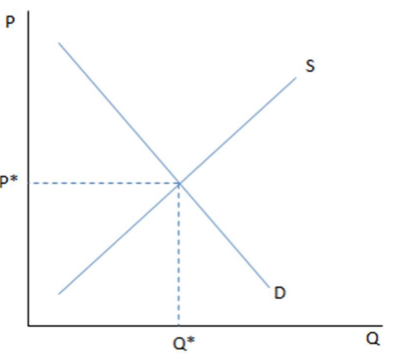
A. D would represent the workers' demand for jobs at each wage.
B. S would represent the firm's supply of jobs at each wage.
C. P* would represent the equilibrium wage.
D. Q* would represent the most employment possible for the market.
C. P* would represent the equilibrium wage.
You might also like to view...
Activities that firms, universities, and governments undertake to increase their knowledge base are referred to as:
A) primary activities. B) research and development (R&D) activities. C) secondary activities. D) tertiary activities.
People's decision about whether to hold money or bonds can be influenced by the interest rate
a. True b. False
If a person owns 2,000 shares in a corporation which has issued 200,000 shares of stock, that person owns ____ of the company and is entitled to ____ of the dividends
a. 1 percent; 1 percent b. 2 percent; 2 percent c. 10 percent; 10 percent d. 20 percent; 20 percent
In the graph showing an increase in aggregate demand, moving from point A to point B indicates ______ of aggregate demand.
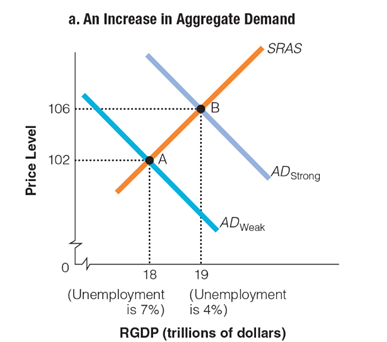
a. prices will decrease
b. prices will increase
c. RGDP will decrease
d. unemployment will increase