Solve the problem.Suppose that the speed of a car, measured in miles per hour (mph), is monitored for some short period of time after the driver applies the brakes. The following table and graph relate the speed of the car to the amount of time, measured in seconds (sec), elapsed from the moment that the brakes are applied. What is happening to the speed of the car during this time frame? In which of the time intervals does the speed change the most?
A. With increasing elapsed time, the speed increases. The speed changes most during the time interval from 12 seconds to 15 seconds.
B. With increasing elapsed time, the speed decreases. The speed changes most during the time interval from 12 seconds to 15 seconds.
C. With increasing elapsed time, the speed decreases. The speed changes most during the time interval from 3 seconds to 6 seconds.
D. With increasing elapsed time, the speed increases. The speed changes most during the time interval from 3 seconds to 6 seconds.
Answer: C
You might also like to view...
Provide an appropriate response.A pharmaceutical company manufactures 3 drugs for high blood pressure, A, B, and C, each of which requires a 2-step production process. The production cost of each drug has a materials and labor component. If the matrices S1 and S2 represent the costs per ounce associated with each step, use the matrix operations on a graphing calculator to write a matrix that shows the total cost of the two steps. S1 =
S1 =  ; S2 =
What will be an ideal response?
Solve the problem.If f varies jointly as q2 and h, and  when q = 4 and
  , find q when
  and
and  .
.
A. 3 B. 2 C. 5 D. 4
Use the properties of logarithms to evaluate the expression without the use of a calculator.log3 3-4
A. 1 B. 3 C. -4 D. -12
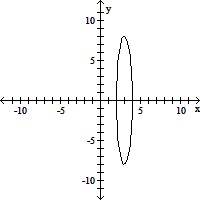
Graph the ellipse.64x2 + y2 - 384x + 512 = 0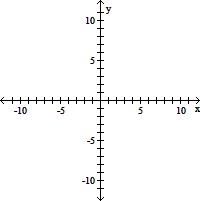
A. 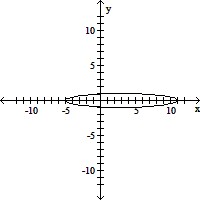
B. 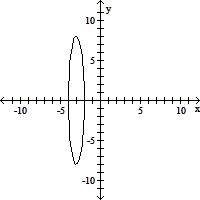
C. 
D.