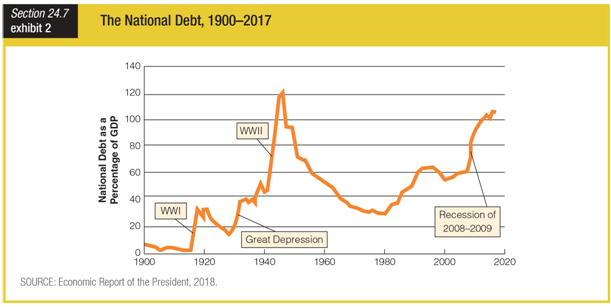
Based on this graph, during the 1940s and the Recession of 2008–2009, the national debt ______.
a. remained below 10 percent of GDP
b. was temporarily paid off
c. was at the same level
d. exceeded 100 percent of GDP
d. exceeded 100 percent of GDP
You might also like to view...
If the economy is suffering from an inflationary gap, the Federal Reserve will engage in what type of policy?
a. expansionary fiscal policy b. contractionary fiscal policy c. expansionary monetary policy d. contractionary monetary policy
Suppose a taxpayer has an income of $70,000 and a taxable income of $60,000, and pays $9,000 in taxes. If the taxpayer says she is taxed at a 15 percent tax rate, she is referring to the
A. Effective tax rate. B. Average tax rate. C. Marginal tax rate. D. Nominal tax rate.
At the end of 2012, the government had a debt of about $11.3 trillion. If during 2013 real GDP rose 2% and inflation was 2.2%, what is the largest deficit the government could have run without raising the debt-to-GDP ratio?
a. about $226.0 billion b. about $248.6 billion c. about $474.6 billion d. about $561.8 billion
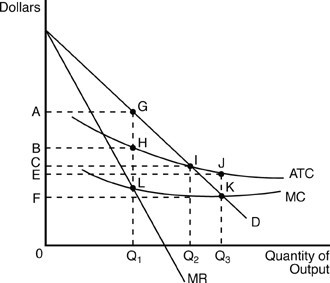 In the above figure, the area of rectangle ABHG represents the monopolist's
A. average total profits. B. maximized economic profits. C. total costs. D. maximized total revenue.