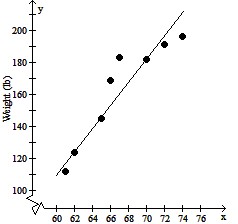
Solve the problem.The following data represents the height (in inches) and weight (in pounds) of 9 randomly selected adults.  Graph the data on a scatter diagram treating height as the independent variable. Find an equation of the line containing the points (62, 124) and (70, 182). Express the relationship using function notation. Graph the line on the scatter diagram. Interpret the slope of the line. Use the line to predict the weight of a person who is 63.2 inches tall. Round to the nearest pound.
 Height (inches)
What will be an ideal response?
| Height (inches) |
W(h) = 7.25h - 325.5;
If height is increased by one inch, then weight will increase by 7.25 pounds;
133 lb
Mathematics
You might also like to view...
Solve the problem.Integrate 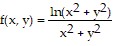 over the region 1 ? x2 + y2 ? 4.
A. ? ln 2 B. 2? ln 2 C. ?(ln 2)2 D. 2?(ln 2)2
Mathematics
Add.+ 
A. 176.71 B. 175.71 C. 175.81 D. 176.81
Mathematics
Use a graphing calculator to approximate the real zeros of the function defined by f(x). Express decimal approximations to the nearest hundredth.f(x) = x4 - 3.10x3 + 0.06x2 + 4.55x - 1.18
A. -0.27, -1.64 B. 1.14, 0.27, 2.33, -1.64 C. -1.14, 0.27, 2.33, 1.64 D. -1.14, 2.33, -1.64
Mathematics
Write the x- and y-intercepts of the graph.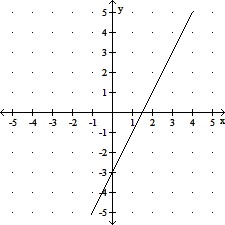
A. x-intercept:  ; y-intercept:
B. x-intercept: -3; y-intercept: 
C. x-intercept: -3; y-intercept: -3
D. x-intercept:  ; y-intercept: -3
Mathematics