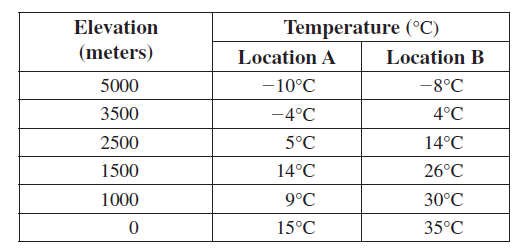
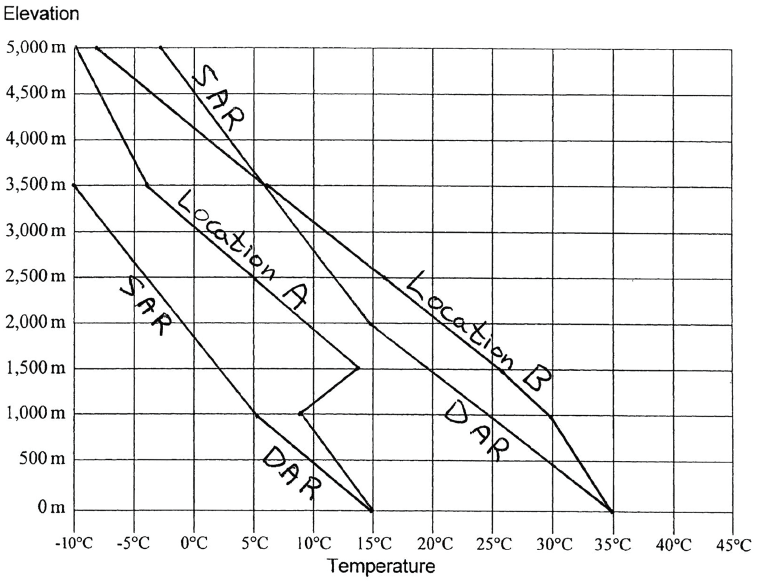
On the following chart, use the sets of hypothetical data to plot the vertical temperature profile (the environmental lapse rate) of the atmosphere in two locations. Using a straightedge, connect the temperature points for Location A with a blue line, and for Location B with a green line (if you do not use colored lines, label each line clearly). After completing the temperature profiles, answer the questions on the following page.


Remember, the vertical temperature profiles show the temperature of the surrounding air through which parcels of air can move. For the following questions, assume that the DAR is 10°C/1000 meters and that the SAR is 6°C/1000 meters.
Environmental & Atmospheric Sciences
You might also like to view...
A good rule: Action and reaction pairs of forces always act on
A. different bodies. B. the same body. C. either of these D. none of the above
Environmental & Atmospheric Sciences
India's motion picture industry is centered in:
A) Delhi B) Mumbai C) Bengaluru D) Kolkata
Environmental & Atmospheric Sciences
All of the following are centers of off-shore banking and financial centers, EXCEPT
A) Cayman Islands. B) France. C) Bahamas. D) Panama. E) Luxembourg.
Environmental & Atmospheric Sciences
How did individuals act to help scientists in the Caribbean Sea?
What will be an ideal response?
Environmental & Atmospheric Sciences